

- Core Web Vitals are Google’s three user-experience metrics: Largest Contentful Paint (loading), Interaction to Next Paint (responsiveness) and Cumulative Layout Shift (visual stability).
- Page caching is the single biggest lever for LCP on WordPress; explicit image dimensions fix most CLS; less JavaScript and fewer third-party scripts improve INP.
- Judge results by field data from real users in Search Console, not only lab scores from PageSpeed Insights.
- Search Console reports a rolling 28-day window, so expect improvements to show gradually over about four weeks.
In this guide
Core Web Vitals problems on WordPress usually trace back to a small set of repeat offenders: render-blocking plugins, unoptimised images, and a theme or page builder shipping more CSS and JavaScript than the page needs. This guide explains what Core Web Vitals measure, how to test them properly, and the ten WordPress fixes that actually move the needle, in rough order of impact.
You don’t need to be a developer to apply most of these. Several are a single setting in a caching plugin; a few need a quick look at your theme or hosting panel. Work through them in order and re-test after each change, so you know which fix made the difference and can undo anything that breaks your layout. Most WordPress sites can move from “Needs improvement” to “Good” on at least one metric within an afternoon of focused work, and the same changes make pages feel faster for every visitor, not just for Google.
What are Core Web Vitals?
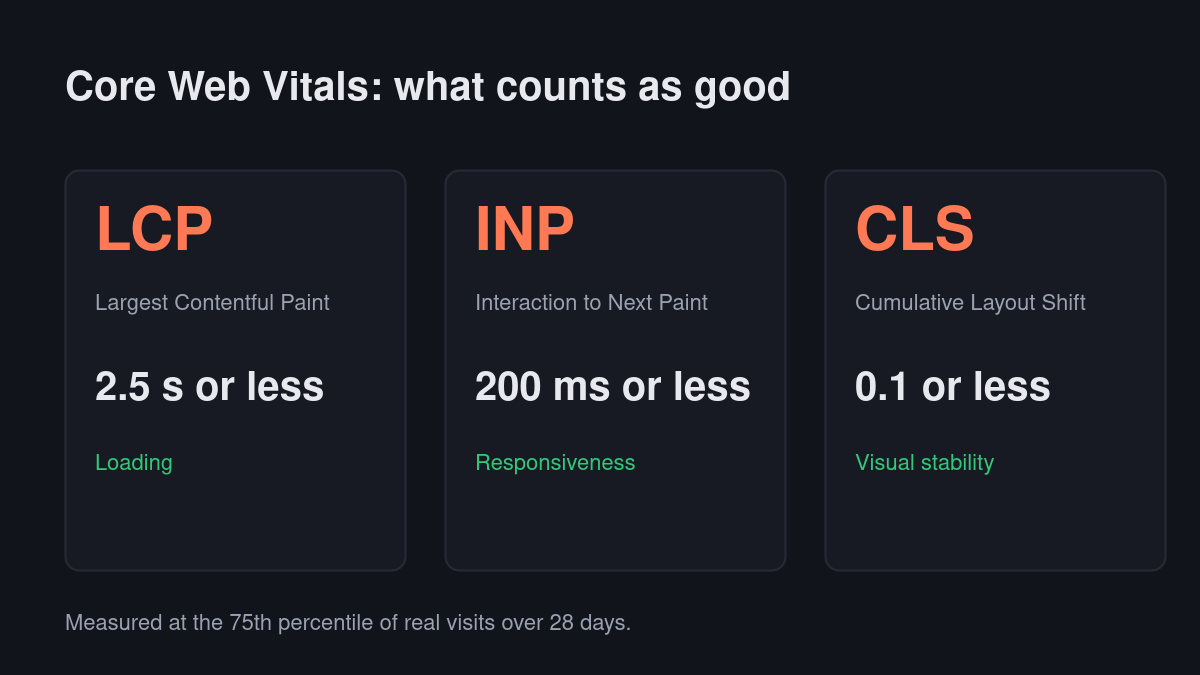
Core Web Vitals are a set of three metrics Google uses to measure the real-world user experience of a web page: how fast its main content loads, how quickly it responds to input, and how stable its layout is while loading. Google’s Web Vitals overview defines the thresholds a page must meet at the 75th percentile of real visits:
| Metric | What it measures | Good | Poor |
|---|---|---|---|
| Largest Contentful Paint (LCP) | How long the largest image or text block takes to render | 2.5 s or less | Over 4 s |
| Interaction to Next Paint (INP) | How quickly the page responds to clicks, taps and key presses | 200 ms or less | Over 500 ms |
| Cumulative Layout Shift (CLS) | How much visible content jumps around while loading | 0.1 or less | Over 0.25 |
INP replaced First Input Delay (FID) as a Core Web Vital in March 2024, so older guides that talk about FID are out of date. Google explains how these metrics fit into its ranking systems in its Core Web Vitals documentation.
How to measure Core Web Vitals on WordPress
There are two kinds of Core Web Vitals data, and mixing them up is the most common source of confusion:
- Field data comes from real Chrome users via the Chrome User Experience Report (CrUX). This is what Google uses, and it appears in the Core Web Vitals report in Search Console and at the top of PageSpeed Insights when enough traffic exists.
- Lab data comes from a single simulated test, such as the Lighthouse score in PageSpeed Insights. It is ideal for debugging because it is repeatable and shows exactly what slowed the page down.
New or low-traffic sites often have no field data yet, so start with lab tests and move to field data as traffic grows. SEOPacket’s Page speed module runs PageSpeed for free and turns the worst issues into a short fix list.
10 WordPress fixes that improve Core Web Vitals
1. Get a real caching layer running
Page caching, not just browser caching, is the single biggest lever for Largest Contentful Paint. Without it, every visit waits for PHP and the database to build the page. If you’re on a host without server-level caching, a plugin like LiteSpeed Cache or WP Rocket with page caching enabled removes that round trip on repeat views entirely.
2. Serve images in modern formats, at the right size
A hero image saved as an uncompressed PNG at 3000px wide when it displays at 800px is a common, avoidable LCP hit. Convert to WebP or AVIF, and make sure your theme outputs srcset so the browser doesn’t download more pixels than it renders. Don’t lazy-load the main image above the fold; it should load immediately.
3. Set an explicit width and height on every image
Missing image dimensions are the most common cause of Cumulative Layout Shift on WordPress sites. The browser doesn’t know how much space to reserve, so the layout jumps when the image finally loads. WordPress adds dimensions automatically for images inserted through the media library, but many themes and hand-coded templates strip or omit them. The same applies to embeds, ads and iframes: reserve their space in advance.
4. Audit plugins for what they load on every page
A contact-form plugin that loads its CSS and JavaScript sitewide, even on pages with no form, is pure waste. Use the free Query Monitor plugin to see what each active plugin loads per page, deactivate plugins you no longer use, and load the rest only where they’re needed.
5. Defer or remove render-blocking JavaScript
Scripts loaded in the page head without defer or async stop the browser from painting anything until they finish downloading and running. This shows up directly in LCP and, when scripts keep running after load, in Interaction to Next Paint. Most caching plugins can defer JavaScript with one setting; test the page afterwards, because a few scripts must still load early.
6. Reduce your font requests
Every extra font family and weight is another network request and another chance for text to reflow. Two families with two weights each is usually enough for a marketing or blog site. Self-host the files, preload the one used above the fold, and use font-display: swap so text appears straight away.
7. Trim third-party scripts
Chat widgets, heat-map trackers and ad tags each add their own JavaScript execution cost, and third-party scripts are among the most common causes of poor INP because they occupy the main thread while people try to interact. Remove any you don’t actively use, and load the rest after the page becomes interactive.
8. Use a lightweight theme or a lean custom build
A page builder that ships a generic CSS framework you use 10% of adds dead weight to every request. Block themes built on WordPress’s native editor usually ship far less code. If you rely on a builder, enable its options to generate page-specific CSS and to drop unused widgets and icon fonts.
9. Move to a current PHP version and clean your database
Upgrading from an old PHP 7.x release to a current, supported PHP 8 version usually cuts server response time (Time to First Byte) with no code changes. Pair it with cleaning up old post revisions and expired transients; a bloated wp_options autoload can slow every request.
10. Test with real field data, not just lab scores
PageSpeed Insights’ lab score and your actual Core Web Vitals in Search Console can disagree. Fix what Search Console’s Core Web Vitals report flags first, because that’s the real-user data Google uses, then use lab tools like PageSpeed Insights to debug why each flagged page is slow.
Which fix improves which Core Web Vitals metric?
| Fix | LCP | INP | CLS |
|---|---|---|---|
| Page caching | Strong | – | – |
| Modern, right-sized images | Strong | – | – |
| Image width and height | – | – | Strong |
| Fewer plugin assets | Moderate | Moderate | – |
| Deferred JavaScript | Strong | Moderate | – |
| Fewer fonts, font-display: swap | Moderate | – | Moderate |
| Fewer third-party scripts | Moderate | Strong | Moderate |
| Lightweight theme | Moderate | Moderate | – |
| Current PHP, clean database | Moderate | – | – |
How to find what’s slowing your LCP element
Fixing LCP starts with knowing which element is being measured. Run the page through PageSpeed Insights and open the diagnostics: it names the Largest Contentful Paint element, usually a hero image, a featured image or a large heading. It also breaks LCP into phases:
- Time to First Byte: how long the server takes to respond. A high value points to caching or hosting.
- Resource load delay: how long before the browser starts downloading the LCP image. A high value often means the image is lazy-loaded or discovered late through CSS.
- Resource load duration: how long the download takes. A high value means the image is too large.
- Element render delay: time between download and paint, often caused by render-blocking CSS or JavaScript.
Whichever phase is largest tells you which of the ten fixes above to apply first.
How to debug INP on WordPress
Interaction to Next Paint is harder to test than LCP because it depends on what visitors actually do. Open the page in Chrome, open DevTools and go to the Performance panel, which shows live Core Web Vitals, including INP, as you click, type and open menus. Interact with the slowest-feeling parts of the page, such as navigation menus, filters, add-to-cart buttons and forms, then record a trace of the slowest interaction.
Long tasks in the trace usually lead back to a specific script: a slider, a chat widget, an analytics tag or a page-builder animation. Remove it, load it later, or replace it with a lighter alternative. On most WordPress sites, cutting third-party scripts does more for INP than any server change.
When is hosting the Core Web Vitals problem?
If your Time to First Byte stays high even with page caching enabled, the server itself is the bottleneck. Signs include slow responses across every page, big differences between repeat tests, and slowdowns at busy times of day. Moving to a host with server-level caching, a current PHP version and data centres close to your audience can improve LCP across the whole site at once. If your visitors are spread across several regions, a content delivery network (CDN) shortens the distance for everyone.
Core Web Vitals on WooCommerce and page-builder sites
WooCommerce stores and sites built with heavy page builders face extra Core Web Vitals challenges. Product pages often combine large image galleries, variation scripts, reviews, and cart fragments that refresh on every page load. Page builders add their own layout CSS, animation libraries and icon fonts, much of which a given page never uses.
Start with the largest wins: make sure cart and checkout pages are excluded from page caching while product and category pages are cached, size gallery images for their thumbnail and zoom views separately, and turn off builder features you don’t use, such as unused widgets, entrance animations and extra icon sets. Test a product page, a category page and a blog post separately, because each template usually has its own bottleneck.
Core Web Vitals on mobile vs desktop
Search Console reports Core Web Vitals for mobile and desktop separately, and mobile is almost always worse. Phones have slower processors and often slower connections, so the same JavaScript that runs smoothly on a laptop can produce a poor INP on a mid-range phone. Because Google indexes the mobile version of your site, prioritise the mobile report: a page that passes on desktop but fails on mobile still has work to do.
When you test in PageSpeed Insights, the mobile tab simulates a mid-range device on a throttled connection, which is closer to many real visitors’ experience than your own fast machine. Improvements that help mobile nearly always help desktop too, so fixing Core Web Vitals for mobile first is the efficient order.
A quick Core Web Vitals checklist
- Page caching enabled and working on every public page
- Hero and featured images in WebP or AVIF, sized for their display width, and not lazy-loaded
- Width and height set on every image, embed and ad slot
- Non-essential JavaScript deferred; unused plugins removed
- No more than two font families, self-hosted, with font-display: swap
- Third-party scripts audited, with non-essential ones loaded late or removed
- Current PHP version and a clean database
- Core Web Vitals report in Search Console checked monthly, with fixes validated
How long until Core Web Vitals improve in Search Console?
Field data in Search Console and PageSpeed Insights is based on the previous 28 days of real visits, so a fix you ship today shows up gradually over roughly four weeks. Once you’ve fixed an issue across a group of pages, use “Validate fix” in the Core Web Vitals report to have Google track the improvement.
Search Console also groups similar URLs together, so one fix to a shared template can move hundreds of pages from “Poor” to “Good” at once. That’s why template-level fixes, such as changing how your theme loads images or fonts, usually beat page-by-page tweaks. Keep a simple log of what you changed and when, so you can match each improvement in the report to the change that caused it.
If the report shows “Not enough usage data”, your site doesn’t yet have enough Chrome visitors for field data. That’s normal for new sites. Keep testing with lab tools in the meantime; the fixes that improve lab scores almost always improve field Core Web Vitals once the data arrives.
Common Core Web Vitals mistakes on WordPress
- Lazy-loading the hero image. It delays the largest element on the page and makes LCP worse, not better.
- Stacking optimisation plugins. Two caching or minification plugins doing the same job often conflict and break pages.
- Chasing a perfect lab score. A score of 100 on one test matters less than passing field data across your important templates.
- Testing only the homepage. Blog posts, product pages and landing pages often use different templates with different problems.
- Ignoring mobile. Google evaluates the mobile experience, where slower devices expose problems a fast desktop hides.
Speed is also part of getting pages indexed in the first place. If some of your pages aren’t showing in Google at all, read our guide to getting WordPress pages indexed by Google faster.
Frequently asked questions
What are good Core Web Vitals scores?
Google rates a page as good when, at the 75th percentile of real visits, Largest Contentful Paint is 2.5 seconds or less, Interaction to Next Paint is 200 milliseconds or less, and Cumulative Layout Shift is 0.1 or less.
Do Core Web Vitals affect Google rankings?
They are part of Google’s page experience signals. Relevance and content quality matter far more, but faster pages can win when competing results are otherwise similar, and they convert better.
Which caching plugin should I use on WordPress?
Use the one that matches your server. LiteSpeed Cache is the natural choice on LiteSpeed hosting; on Nginx or Apache, a well-configured page-cache plugin or your host’s built-in cache does the same job.
How do I measure Core Web Vitals for free?
Run Google PageSpeed Insights or the Core Web Vitals report in Search Console. SEOPacket’s Page speed module runs PageSpeed free and turns the worst issues into a short fix list.
Why does PageSpeed Insights show different scores each time?
Lab tests run on simulated devices and networks, so small variations in server response and network conditions change the score between runs. Field data in Search Console is steadier because it averages 28 days of real visits.

Leave a Reply